Challenge
AARP Services Inc (ASI) is a for-profit fraction of AARP focused on research and quality control. One of their greatest accomplishments is the Caregiving program, which allows the elderly and infirm to receive the appropriate care and support they need from caregivers who are passionate about helping other people.
Action
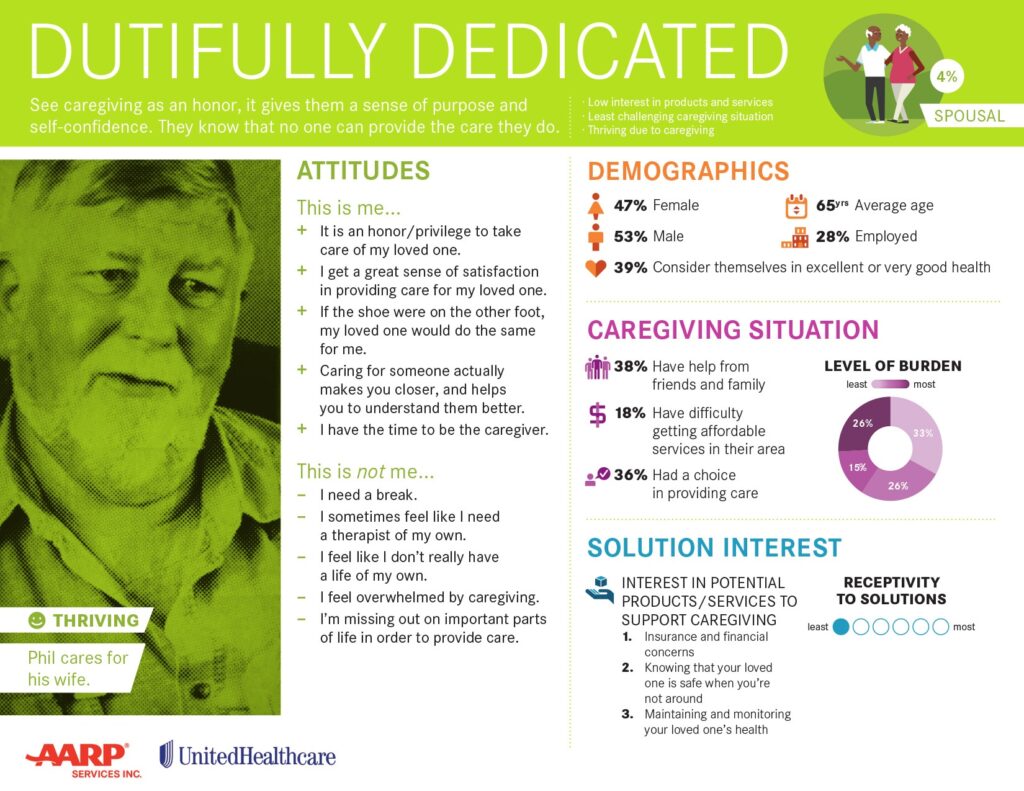
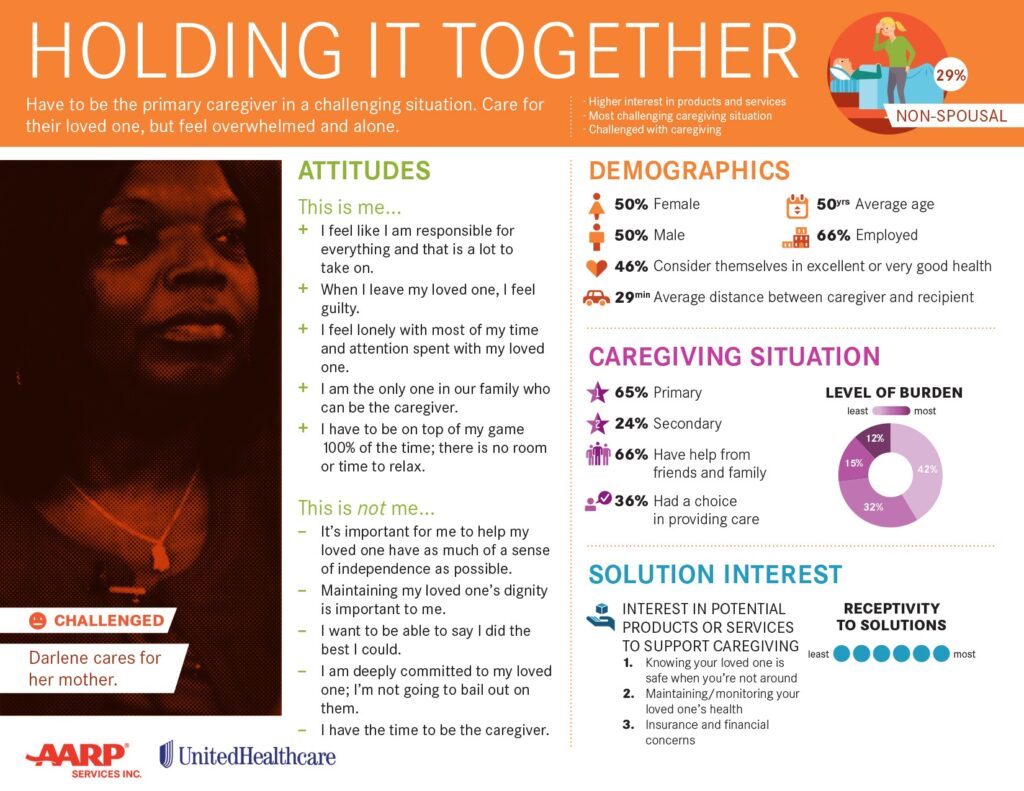
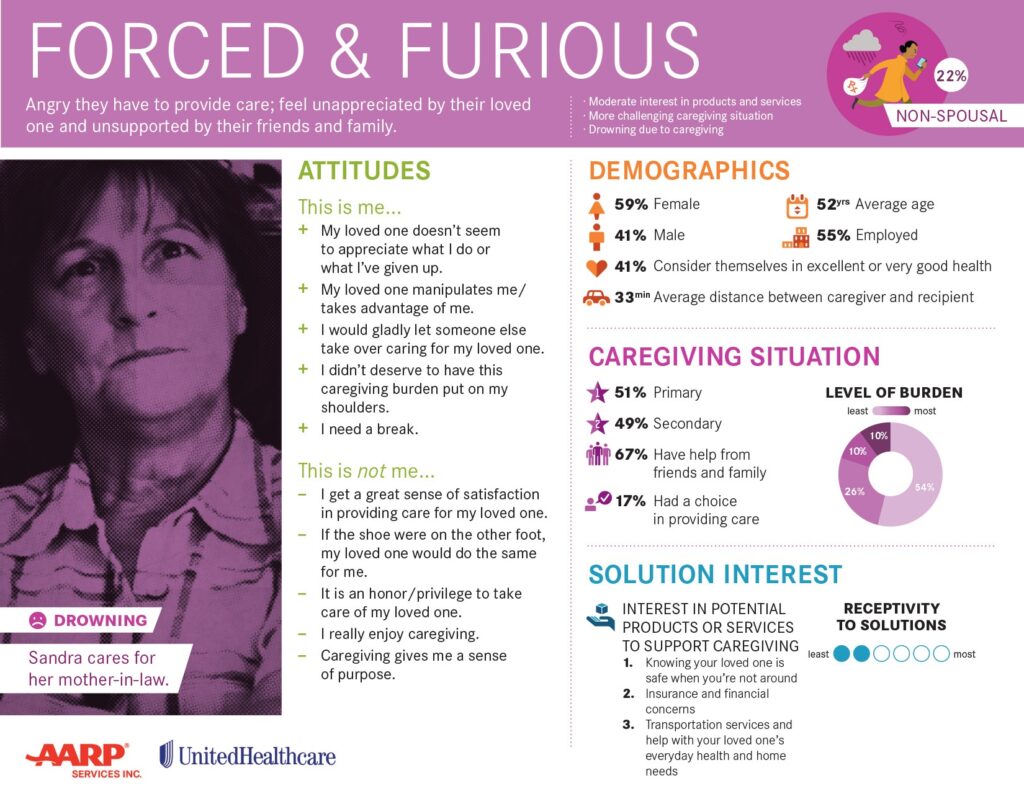
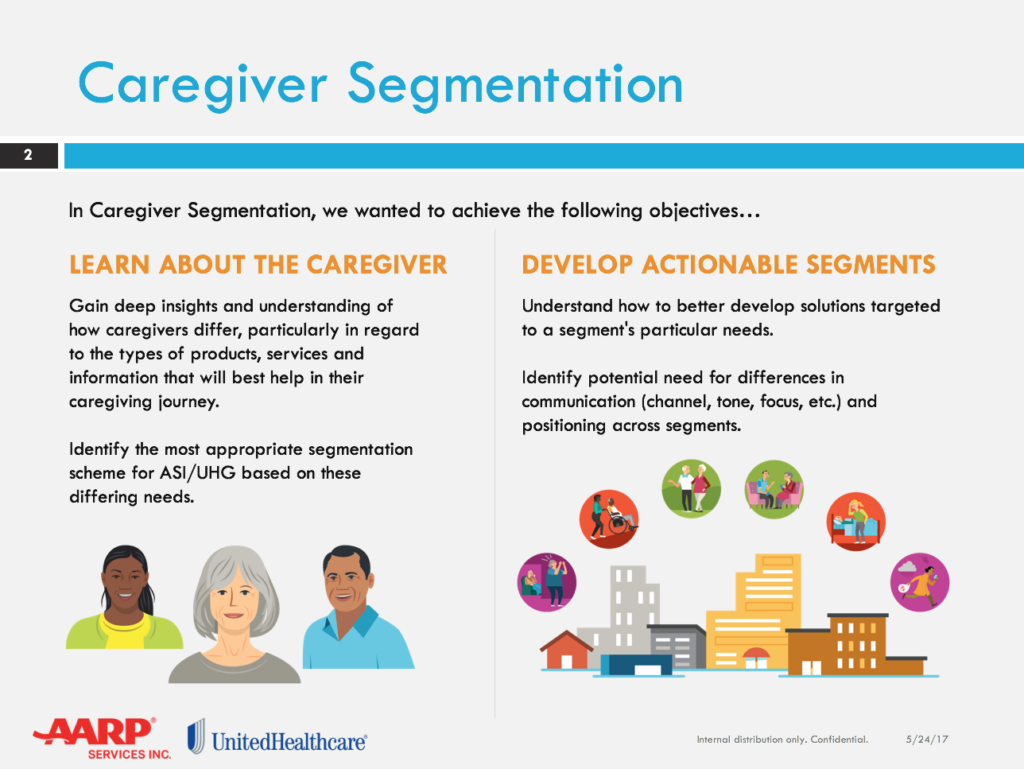
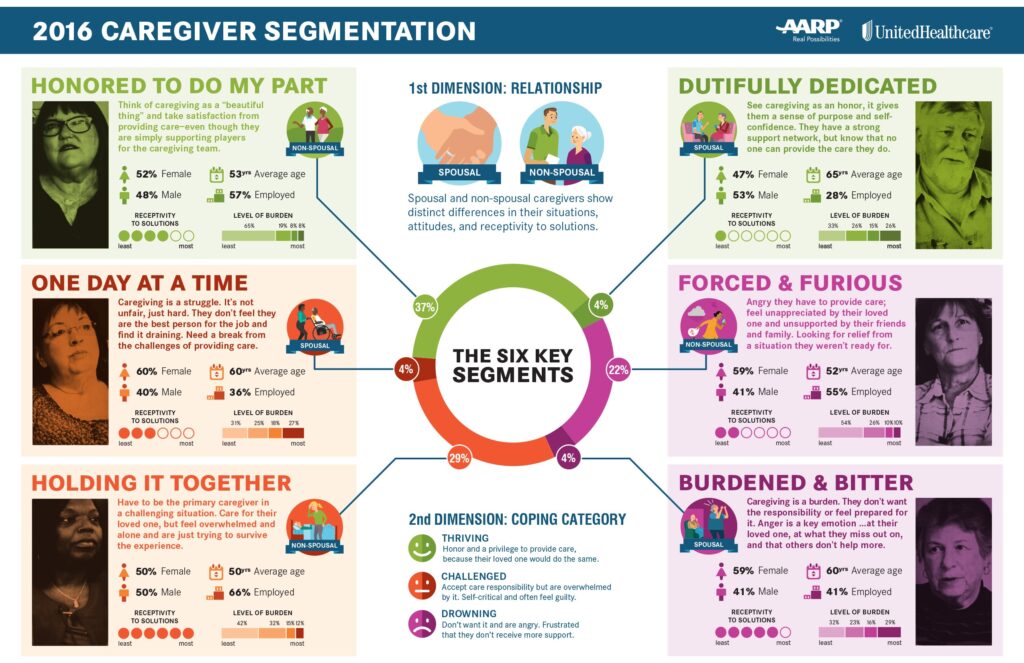
AARP ASI reached out to us to help create a series of infographics that outlines their Caregiving Segmentation—a look at the demographic breakdown of caregivers. The infographic highlights the range of work required of some caregivers and their ability to cope with such tasks. The audience is innovators and entrepreneurs—people and companies who are able to provide products and services to these incredibly diverse groups of caregivers.
ASI provided us a great deal of data, from video interviews to research PowerPoints, and our challenge was to aggregate and distill statistics and emotions in a clear and concise way. Color helped to to distinguish the three major coping categories: Thriving, Challenged, and Drowning; then, based off of real-world responses from actual caregivers, we identified key terms that applied to each category. Another dimension, Spousal Care vs. Non-Spousal Care, was applied to each scenario to show the distinct differences in situations, attitudes, and receptivity to solutions.
Result
We designed large-format “placement” overviews, a multi-page document with all segments, and a more detailed presentation version. By making the data easier to understand, this information is more accessible to entrepreneurs and innovators, allowing them to more easily visualize opportunities for helping people and finding success.
How we helped
-
 Data visualization
-
 Icon design
-
 Photo editing
-
 Publication design

Super. The visual looks great!