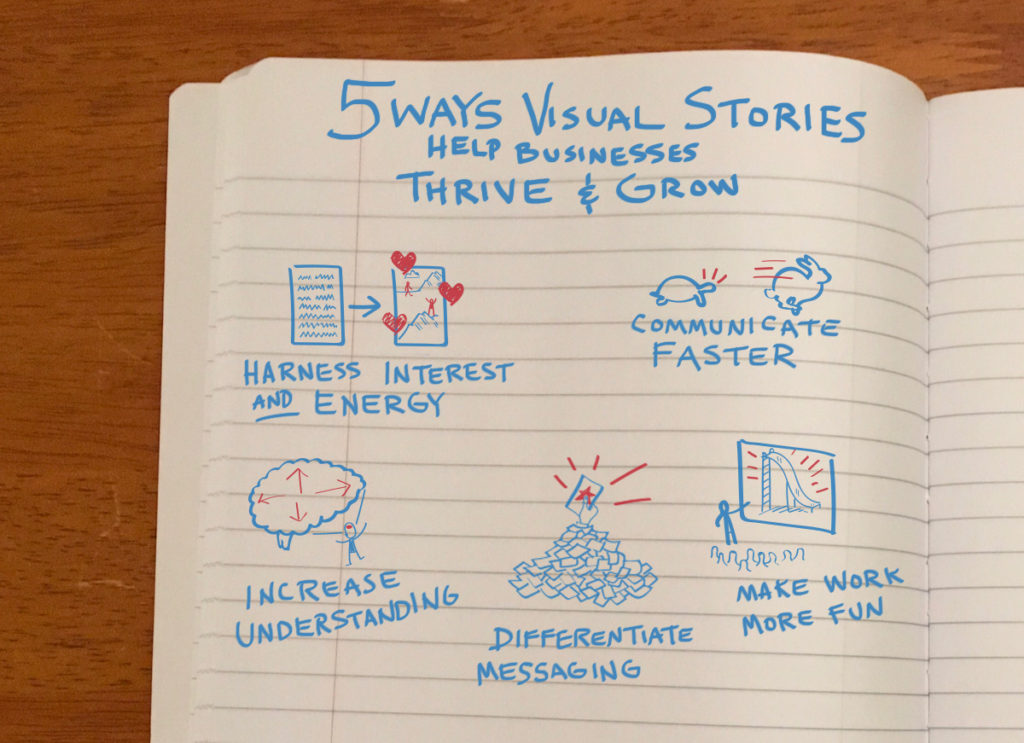
5 ways visual stories help organizations grow and thrive
We’ll just come right out and say it: visual stories—whether infographics, animations, illustrations, maps, or charts—are critical to any strategic communication plan.
Of course we say that, right? We design visual stories for a living.
But this is true whether you believe it or not. It’s true whether your messaging is for an internal audience or is part of a marketing effort. It’s true whether you’re a Fortune 500 company, a startup, or a non-profit. It’s true because research shows that visual stories “help people organize and process information faster—and act on it more quickly.”*
Here are five ways visuals stories can help your business, institution, department, or team grow and thrive:
1. Harness interest and energy
Infographics and animations quickly engage audiences with your content. For example, visualizing current states (usually pain!) and future states (usually gain!) is a powerful way to bring emotion to a business story, and help people to connect to it. For most people, mission statements are usually too broad and vague to act on (but make a nice North Star). And, Gantt charts are usually too detailed and dull to get excited about (but provide critical instruction). A visual story helps to bridge these two crucial pieces of content by making key details more tangible in the context of a narrative that motivates its audience to take action.
Here’s how we worked with Gartner and MIT to bring energy and understanding to improving the institute’s budgeting, forecasting, and grant process.
2. Communicate faster
Even better, when visual stories highlight and summarize the most important information from longer, more detailed reports, presentations, white papers, or even books—people understand more quickly. Of course we’re not suggesting depth is bad, we just know that impact matters in today’s fast-paced world. An impact is quick, forceful, and interesting. So save the long emails and 300 slide decks for the people who truly do need to “Learn more,” and communicate faster with large groups using words and pictures.
Here’s one of the many examples of how we collaborate with AARP to quickly and clearly summarize important research to their member base.
3. Increase understanding
Not only do you gain a speed advantage, you also increase your audience’s understanding. Despite the dominance of word-based language as our default communication tool (it is highly convenient, of course), our brains are wired for visuals. We respond to faces, to emotion, to color, to order and simplicity. One study showed that after three days, subjects could only recall 10% of information presented in text alone, but were able to remember 65% of the messaging when the text was presented with relevant visuals.*
Here’s how we partnered with Adobe to explain something that is both everyday—yet also mysterious: Where Do PDFs Come From?
4. Differentiate messaging
At the very least, a visual story helps a message stand out and gain attention. Let’s face it, long-format blog-style infographics have been attracting attention online for more than 10 years and the payoff for animated explanations has been increasing exponentially for at least the last five, as broadband and high-speed mobile access has increased. Even the poorly executed ones attract attention. We prefer the good ones, but the truth is that it’s the visual content acting as the key initial differentiator—while quality content is what generates understanding and creates trust. Visuals help in smaller doses as well: on Facebook, images get 53% more Likes, 104% more comments, and 84% more click-throughs.* On Twitter, retweets increase 150% when an image is included (and get almost 20% more clicks and nearly 90% more favorites).*
Here’s how we helped Seattle-based startup Arivale differentiate its value proposition.
5. Make work (more) fun
Remember in school, when the teacher would play a video or do something other than the same old routine? It works at work too. For important internal messaging, change initiatives, or product/project rollouts, a visual story can help bring clarity and urgency. Of course, the effort involved is quite the opposite of simply pressing “PLAY”—it takes a lot of work to create a good infographic, map, presentation, or animation. Relax, though, we don’t mean you should do this every day or for everything—just don’t underestimate the connective potential of storytelling when supercharged with novelty, variety, fun, and impact. That’s literally how the multi-billion dollar advertising and entertainment industries work.
Here’s an example of how we’ve worked with a large health and science non-profit to breathe life and energy into its annual meetings.
Success on any one of these five things is a win. All five? Big win.
Illustration by Lin Wilson / Tremendousness.