The Tremendous 10 link roundup, #125
- A Wikipedia For Data Visualizations Is Here | “You have one dataset, and countless ways to visualize it. Bar chart? Tree graph? The dreadful pie chart? Now all your options are in one beautifully designed location: the Data Viz Project, which has more than 150 types of data visualizations, all searchable by type of dataset (chart, diagram, table), input data, function (comparison, trend over time), and shape (square, line, map).”
- This Font Makes Graphics Out Of Numbers In Seconds | “Inspired by Edward Tufte’s “sparklines,” the typeface turns typed numerals into inline data visualizations.”
- How Reading Rewires Your Brain for More Intelligence and Empathy | “Fitness headlines promise staggering physical results: a firmer butt, ripped abs, bulging biceps. Nutritional breakthroughs are similar clickbait, with attention-grabbing, if often inauthentic—what, really, is a “superfood?”—means of achieving better health. Strangely, one topic usually escaping discussion has been shown, time and again, to make us healthier, smarter, and more empathic animals: reading.”
- Lynda Barry on How the Smartphone Is Endangering Three Ingredients of Creativity: Loneliness, Uncertainty & Boredom | “In the spring of 2016, the great cartoonist and educator, Lynda Barry, did the unthinkable, prior to giving a lecture and writing class at NASA’s Goddard Space Flight Center. She demanded that all participating staff members surrender their phones and other such personal devices. Her victims were as jangled by this prospect as your average iPhone-addicted teen, but surrendered, agreeing to write by hand, another antiquated notion Barry subscribes to…”
- Designer’s Self-Checklist: what kind of designer are you or want to become? | “Some of the characteristics of a designer that you might be interested in reading about during your free time. Who knows? You might be motivated :)”
- Science of storytelling: why and how to use it in your marketing | “A look at how humans have always loved stories, and six tips for incorporating them into your digital marketingScience of storytelling: why and how to use it in your marketing. A look at how humans have always loved stories, and six tips for incorporating them into your digital marketing.”
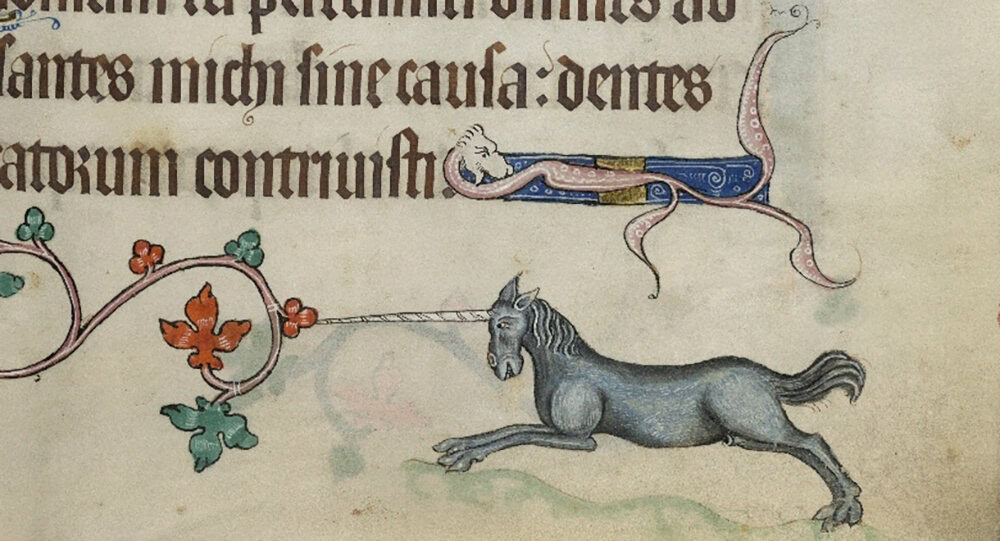
- The Strange and Grotesque Doodles in the Margins of Medieval Books | “‘Manuscripts can be seen as time capsules,’ says Johanna Green, Lecturer in Book History and Digital Humanities at the University of Glasgow. ‘And marginalia provide layers of information as to the various human hands that have shaped their form and content.'”
- I Create Fictional Maps That Honour Nature, Animals And Extraordinary People | “The “maps” are all divided into different countries and every mountain, every lake, every city and every ocean in these pieces are named after everything relevant to the title of each piece. Take for example Elephantidae – Land of the Elephant (which is part of the series called Mappa Animalia). Everything in this “map” is named after both fictional and actual elephant species that are either extinct or still around today.”
- The Animated Bayeux Tapestry: A Novel Way of Recounting The Battle of Hastings (1066) | “While the Bayeux Tapestry may have been inaccessible to most people for however many centuries it has existed, you can now stand before it in its home of Bayeux, or see the very convincing replica at Britain’s Reading Museum. (You’ll note in both cases that the Bayeux tapestry is not, in fact, a tapestry, woven on a loom, but a painstaking, hand-stitched embroidery.) Or, rather than traveling, you can watch [a] video, an animated rendition of the tapestry’s story by filmmaker David Newton and sound designer Marc Sylvan.” Related: Violent Rabbit Illustrations Found in the Margins of Medieval Manuscripts
- So much for that Voynich manuscript “solution” | “Librarians would have “rebutted it in a heartbeat,” says medieval scholar.”
Image: ancient doodles (in the public domain) via link #7.